Great Depression in the United States/Tutorials: Difference between revisions
Jump to navigation
Jump to search

imported>Nick Gardner (New page: {{subpages}}) |
imported>Nick Gardner No edit summary |
||
| Line 1: | Line 1: | ||
{{subpages}} | {{subpages}} | ||
::::::::{| class="wikitable" | |||
!style="background:#eeeeee;" |Depression Data<ref>Source GNP: U.S. Dept of Commerce, National Income and Product Accounts[http://www.huppi.com/kangaroo/GDPreal.htm]; Mitchell 446, 449, 451; Money supply M2[http://home.att.net/~rdavis2/cpi_m2.html]</ref> | |||
!style="background:#eeeeee;" |1929 | |||
!style="background:#eeeeee;" |1931 | |||
!style="background:#eeeeee;" |1933 | |||
!style="background:#eeeeee;" |1937 | |||
!style="background:#eeeeee;" |1938 | |||
!style="background:#eeeeee;" |1940 | |||
|- | |||
|align="center"|Real Gross National Product (GNP) <sup>1</sup> | |||
|align="center"|101.4 | |||
|align="center"| 84.3 | |||
|align="center"| 68.3 | |||
|align="center"|103.9 | |||
|align="center"|103.7 | |||
|align="center"|113.0 | |||
|- | |||
|align="center"|Consumer Price Index <sup>2</sup> | |||
|align="center"|122.5 | |||
|align="center"|108.7 | |||
|align="center"| 92.4 | |||
|align="center"|102.7 | |||
|align="center"| 99.4 | |||
|align="center"|100.2 | |||
|- | |||
|align="center"|Index of Industrial Production <sup>2</sup> | |||
|align="center"|109 | |||
|align="center"| 75 | |||
|align="center"| 69 | |||
|align="center"|112 | |||
|align="center"| 89 | |||
|align="center"|126 | |||
|- | |||
|align="center"|Money Supply M2 ($ billions) | |||
|align="center"|46.6 | |||
|align="center"|42.7 | |||
|align="center"|32.2 | |||
|align="center"|45.7 | |||
|align="center"|49.3 | |||
|align="center"|55.2 | |||
|- | |||
|align="center"|Exports ($ billions) | |||
|align="center"|5.24 | |||
|align="center"|2.42 | |||
|align="center"|1.67 | |||
|align="center"|3.35 | |||
|align="center"|3.18 | |||
|align="center"|4.02 | |||
|- | |||
|align="center"|Unemployment (% of civilian work force) | |||
|align="center"| 3.1 | |||
|align="center"|16.1 | |||
|align="center"|25.2 | |||
|align="center"|13.8 | |||
|align="center"|16.5 | |||
|align="center"|13.9 | |||
|} | |||
<sup>1</sup> in 1929 dollars<br> | |||
<sup>2</sup> 1935-39 = 100 | |||
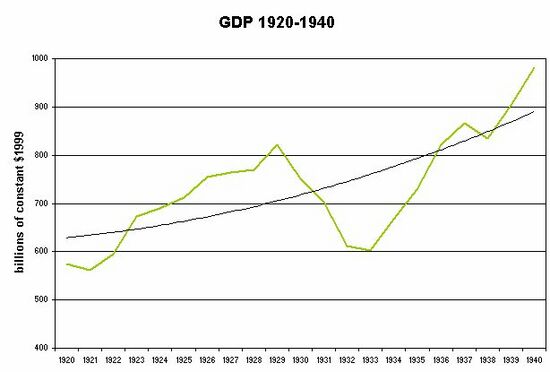
[[Image:Gdp20-40.jpg|thumb|center|550px|Chart 1: GDP annual pattern and long-term trend, 1920-40, in billions of constant dollars<ref> based on data in Susan Carter, ed. ''Historical Statistics of the US: Millennial Edition'' (2006) series Ca9 </ref>]] | |||
<references/> | |||
Revision as of 06:02, 29 January 2009
Depression Data[1] 1929 1931 1933 1937 1938 1940 Real Gross National Product (GNP) 1 101.4 84.3 68.3 103.9 103.7 113.0 Consumer Price Index 2 122.5 108.7 92.4 102.7 99.4 100.2 Index of Industrial Production 2 109 75 69 112 89 126 Money Supply M2 ($ billions) 46.6 42.7 32.2 45.7 49.3 55.2 Exports ($ billions) 5.24 2.42 1.67 3.35 3.18 4.02 Unemployment (% of civilian work force) 3.1 16.1 25.2 13.8 16.5 13.9
1 in 1929 dollars
2 1935-39 = 100

Chart 1: GDP annual pattern and long-term trend, 1920-40, in billions of constant dollars[2]