Great Depression in the United States/Tutorials: Difference between revisions
Jump to navigation
Jump to search

imported>Nick Gardner |
imported>Nick Gardner No edit summary |
||
| Line 21: | Line 21: | ||
== | ==Components of expenditure== | ||
(billions of 1929 dollars) | |||
::::{| class="wikitable" | ::::{| class="wikitable" | ||
| Line 97: | Line 97: | ||
:::Source: Kendrik 1961 <ref name=Temin> Quoted in Peter Temin: ''Did Monetary Forces Cause the Great Depression?'', W W Norton 1976</ref> | :::Source: Kendrik 1961 <ref name=Temin> Quoted in Peter Temin: ''Did Monetary Forces Cause the Great Depression?'', W W Norton 1976</ref> | ||
==Industrial Production== | |||
(1935-9 = 100, seasonally corrected) | |||
:::::{| class="wikitable" | |||
! | |||
!style="background:#eeeeee;" |Jan | |||
!style="background:#eeeeee;" |Feb | |||
!style="background:#eeeeee;" |Mar | |||
!style="background:#eeeeee;" |April | |||
!style="background:#eeeeee;" |May | |||
!style="background:#eeeeee;" |June | |||
!style="background:#eeeeee;" |July | |||
!style="background:#eeeeee;" |Aug | |||
!style="background:#eeeeee;" |Sep | |||
!style="background:#eeeeee;" |Oct | |||
!style="background:#eeeeee;" |Nov | |||
!style="background:#eeeeee;" |Dec | |||
|- | |||
|align="center"|1929 | |||
|align="center"| | |||
|align="center"| | |||
|align="center"| | |||
|align="center"| | |||
|align="center"| | |||
|align="center"| | |||
|align="center"|114 | |||
|align="center"|114 | |||
|align="center"|112 | |||
|align="center"|110 | |||
|align="center"|105 | |||
|align="center"|100 | |||
|- | |||
|align="center"|1930 | |||
|align="center"|100 | |||
|align="center"|100 | |||
|align="center"|98 | |||
|align="center"|98 | |||
|align="center"|96 | |||
|align="center"|93 | |||
|align="center"|89 | |||
|align="center"|86 | |||
|align="center"|85 | |||
|align="center"|83 | |||
|align="center"|81 | |||
|align="center"|79 | |||
|- | |||
|align="center"|1931 | |||
|align="center"|78 | |||
|align="center"|79 | |||
|align="center"|80 | |||
|align="center"|80 | |||
|align="center"|80 | |||
|align="center"|77 | |||
|align="center"|76 | |||
|align="center"|73 | |||
|align="center"|68 | |||
|align="center"|67 | |||
|align="center"|66 | |||
|align="center"|64 | |||
|- | |||
|align="center"|1932 | |||
|align="center"|64 | |||
|align="center"|63 | |||
|align="center"|62 | |||
|align="center"|58 | |||
|align="center"|56 | |||
|align="center"|54 | |||
|align="center"|53 | |||
|align="center"|54 | |||
|align="center"|58 | |||
|align="center"|60 | |||
|align="center"|59 | |||
|align="center"|58 | |||
|} | |||
:::::Source: Federal Reserve Bulletin (quoted in Bernanke<ref name=Bernanke> Ben Bernanke: ''Essays on the Great Depression'', Princeton University Press, 2000</ref>.) | |||
==Price Indexes== | ==Price Indexes== | ||
| Line 212: | Line 289: | ||
==Fiscal Stance== | ==Fiscal Stance== | ||
(Full employment deficit - see the [[/Related Articles|Glossary]]) | |||
{| class="wikitable" | {| class="wikitable" | ||
| Line 252: | Line 329: | ||
|} | |} | ||
Sources: De Long [http://econ161.berkeley.edu/pdf_files/Defining_Moment_Draft.pdf] and Krugman [http://krugman.blogs.nytimes.com/2008/11/10/fiscal-fdr/] | :Sources: De Long [http://econ161.berkeley.edu/pdf_files/Defining_Moment_Draft.pdf] and Krugman [http://krugman.blogs.nytimes.com/2008/11/10/fiscal-fdr/] | ||
==Output and Unemployment== | ==Output and Unemployment== | ||
(Output: 1935-39 = 100) | |||
(Unemployment: - excluding WPA employees - % of civilian labour force) | |||
:::::{| class="wikitable" | :::::{| class="wikitable" | ||
| Line 300: | Line 377: | ||
!style="background:#eeeeee;" |1933 | !style="background:#eeeeee;" |1933 | ||
|- | |- | ||
|align="center"|Percent of operating banks<ref | |align="center"|Percent of operating banks<ref name=Bernanke/> | ||
|align="center"|5.6 | |align="center"|5.6 | ||
|align="center"|10.5 | |align="center"|10.5 | ||
| Line 309: | Line 386: | ||
==Stock exchange performance== | ==Stock exchange performance== | ||
(End-year Standard and Poor Composite series 1941-43 = 100, and annual earnings) | |||
(Averages of monthly Cowles series 1926=100 , and annual earnings) | |||
===Price indexes=== | ===Price indexes=== | ||
| Line 367: | Line 444: | ||
|} | |} | ||
Source: Temin (1976) <ref name=Temin> Peter Temin: Did Monetary Forces Cause the Great Depression'', WW Norton & co, 1976</ref> | ::Source: Temin (1976) <ref name=Temin> Peter Temin: Did Monetary Forces Cause the Great Depression'', WW Norton & co, 1976</ref> | ||
==References== | ==References== | ||
<references/> | <references/> | ||
Revision as of 06:25, 14 February 2009
- Statistics of the Depression
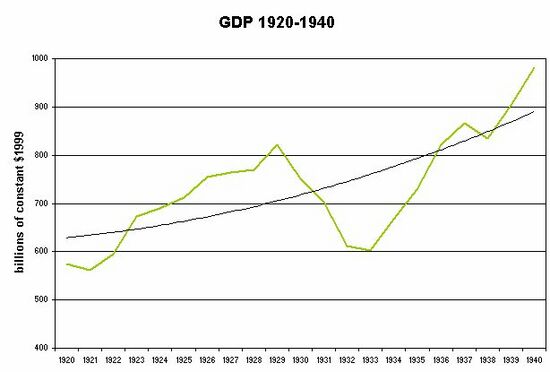
GDP Trend

Chart 1: GDP annual pattern and long-term trend, 1920-40, in billions of constant dollars[1]
- ↑ based on data in Susan Carter, ed. Historical Statistics of the US: Millennial Edition (2006) series Ca9
Employment Trend

Components of expenditure
(billions of 1929 dollars)
1926 1927 1928 1929 1930 1931 1932 1933 1934 1935 1936 1937 Gross National Product 96.4 97.3 98.5 104.4 95.1 89.5 76.4 74.2 80.8 91.4 100.9 109.1 Consumer Spending 71.5 73.2 74.8 79.0 74.7 72.2 66.0 64.6 68.0 72.3 79.7 82.6 Gross Investment 17.1 15.6 14.5 16.2 10.5 6.8 0.8 0.3 1.8 8.8 9.3 14.6 Construction 10.7 10.4 9.8 8.7 6.4 4.5 2.4 1.9 2.0 2.8 3.9 4.6
- Source: Kendrik 1961 [1]
Industrial Production
(1935-9 = 100, seasonally corrected)
Jan Feb Mar April May June July Aug Sep Oct Nov Dec 1929 114 114 112 110 105 100 1930 100 100 98 98 96 93 89 86 85 83 81 79 1931 78 79 80 80 80 77 76 73 68 67 66 64 1932 64 63 62 58 56 54 53 54 58 60 59 58
- Source: Federal Reserve Bulletin (quoted in Bernanke[2].)
Price Indexes
(1947-49 = 100)
1926 1927 1928 1929 1930 1931 1932 1933 1934 1935 1936 1937 Wholesale Prices 65.0 62.0 62.9 61.9 56.1 47.4 42.1 42.8 48.7 52.0 52.5 56.1 Consumer Prices 75.6 74.2 73.3 73.3 71.4 65.0 58.4 55.3 57.2 58.7 59.3 61.4
- Source Historical Statistics[1]
Money Supply
(billions of dollars)
1926 1927 1928 1929 1930 1931 1932 1933 1934 1935 1936 1937 M1 25.9 25.9 26.2 26.4 25.4 23.6 20.5 19.4 21.5 25.5 29.2 30.3 M2 43.3 44.5 46.1 46.2 45.2 41.7 34.6 30.8 33.3 38.4 42.8 45.0 High-powered money 7.1 7.2 7.1 7.1 6.9 7.3 7.8 8.2 9.1 10.7 12.2 13.4
- Source: Friedman and Schwartz [1]
Fiscal Stance
(Full employment deficit - see the Glossary)
| 1929 | 1930 | 1931 | 1932 | 1933 | 1934 | 1935 | 1936 | 1937 | 1938 | 1939 | 1940 | 1941 | 1942 | 1943 | 1944 | |
|---|---|---|---|---|---|---|---|---|---|---|---|---|---|---|---|---|
| Deficit % of potential GDP | -0.5 | -1.5 | -1.0 | 2.0 | 2.0 | 2.0 | 2.0 | 2.5 | 0 | 1.0 | 1.0 | 0 | 1.0 | 2.0 | 15 | 25 |
Output and Unemployment
(Output: 1935-39 = 100) (Unemployment: - excluding WPA employees - % of civilian labour force)
1929 1931 1933 1934 1935 1936 1937 1938 Industrial Production 109 75 69 112 Unemployment 3.1 16.1 20.6 16.0 14.2 9.9 9.1 12.5
- Source: Historical Statistics
Bank Failures
1930 1931 1932 1933 Percent of operating banks[2] 5.6 10.5 7.8 12.9
Stock exchange performance
(End-year Standard and Poor Composite series 1941-43 = 100, and annual earnings) (Averages of monthly Cowles series 1926=100 , and annual earnings)
Price indexes
1927 1928 1929 1930 1931 1932 Standard & Poor 17.7 24.4 21.5 15.3 8.1 6.9 Cowles 118 150 190 150 95 49
Price/earnings ratios
1927 1928 1929 1930 1931 1932 Standard & Poor 15.9 17.6 13.3 15.8 13.3 16.8 Cowles 13.2 13.7 16.1 21.1 33.7 138.9
- Source: Temin (1976) [1]