File:Scholarly-journal-map-journal.pone.0004803.g005-scale-0.75.png
Original file (1,550 × 1,475 pixels, file size: 1.75 MB, MIME type: image/png)
Summary
Figure 5 of
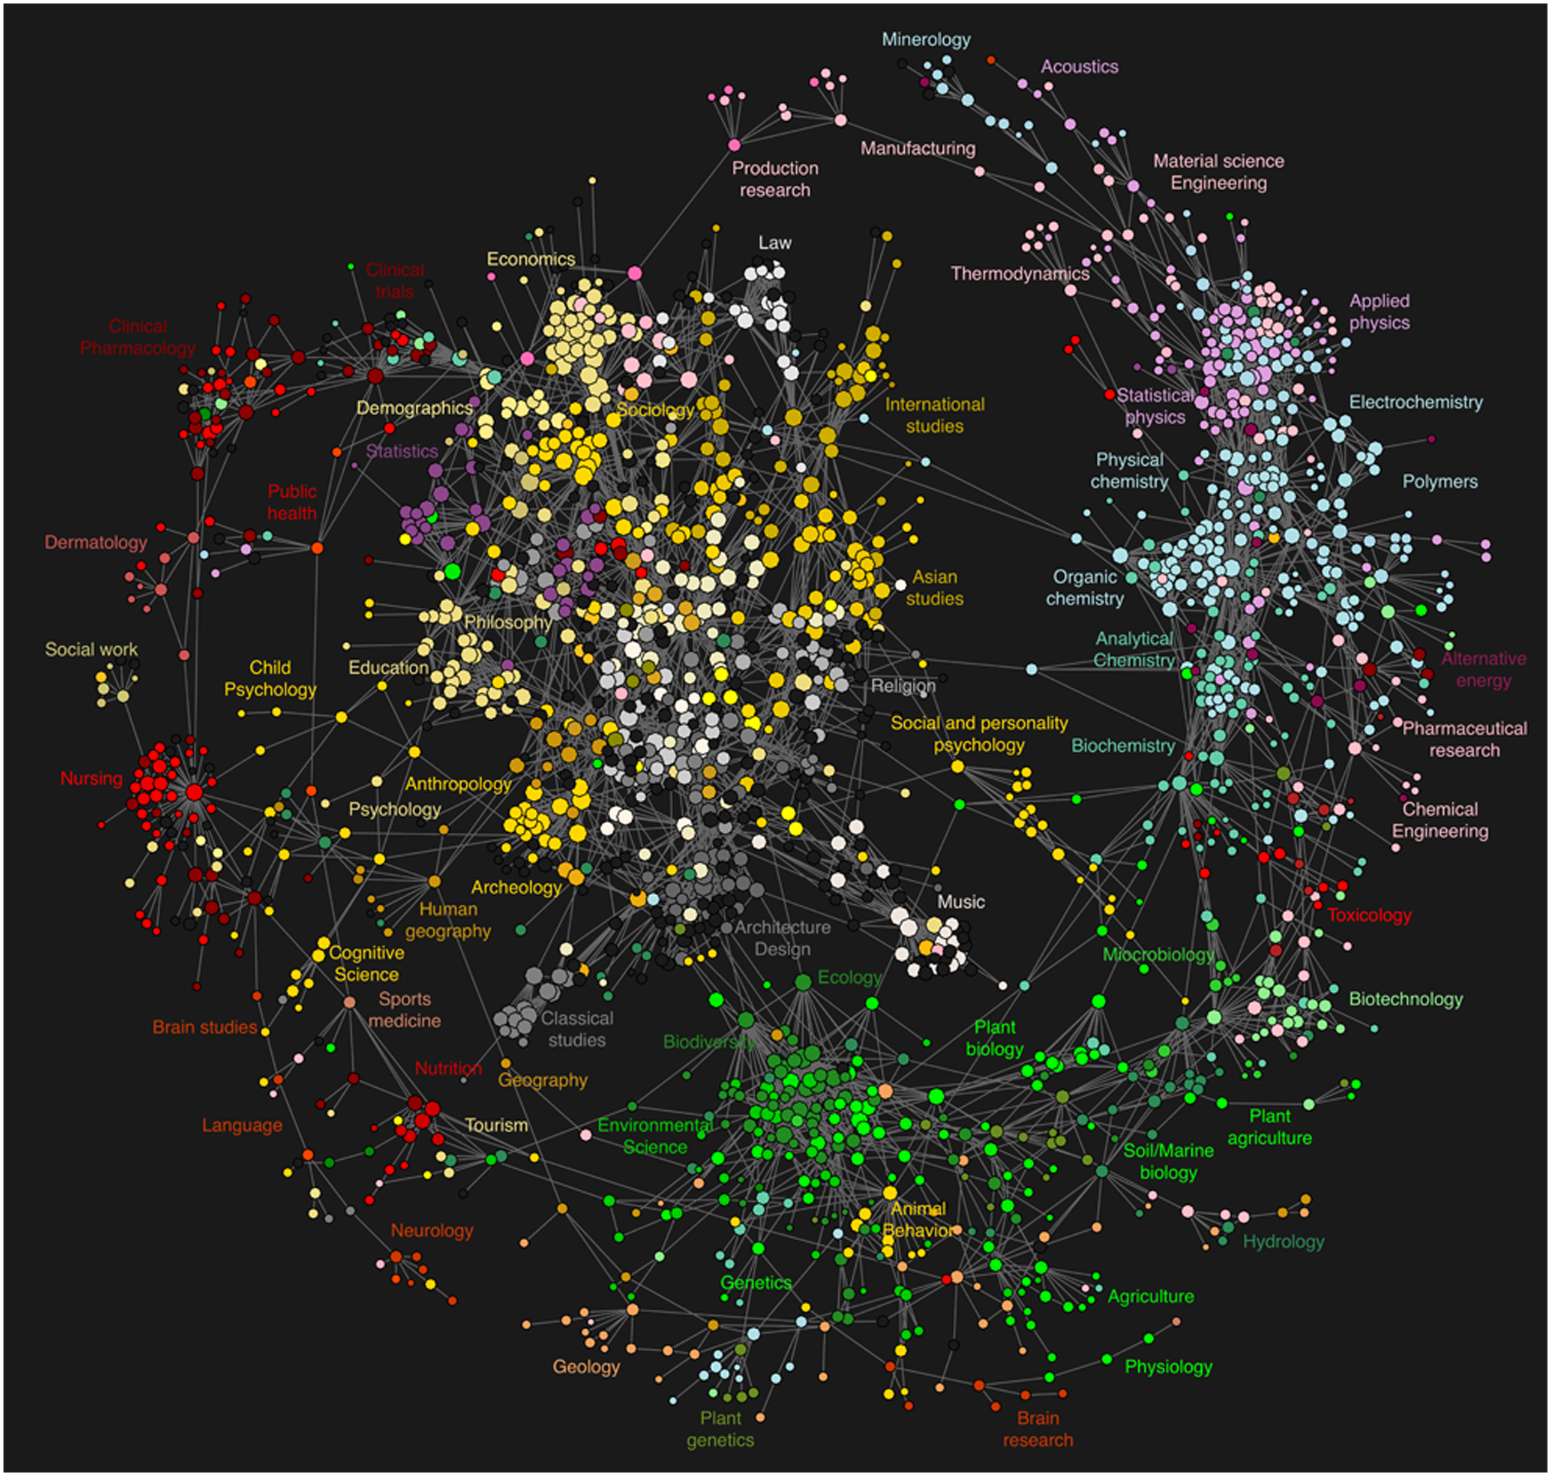
Bollen, J.; H. Van De Sompel & A. Hagberg et al. (2009), "Clickstream Data Yields High-Resolution Maps of Science", PLoS ONE 4 (3), DOI:10.1371/journal.pone.0004803 [e]
Figure legend: Map of science derived from clickstream data. Circles represent individual journals. The lines that connect journals are the edges of the clickstream model in . Colors correspond to the AAT classification of the journal. Labels have been assigned to local clusters of journals that correspond to particular scientific disciplines.

High-resolution version available as TIFF via http://www.plosone.org/article/fetchObjectAttachment.action?uri=info%3Adoi%2F10.1371%2Fjournal.pone.0004803.g005&representation=TIF.
License: CC-BY 2.5
Licensing/Copyright status
File history
Click on a date/time to view the file as it appeared at that time.
| Date/Time | Thumbnail | Dimensions | User | Comment | |
|---|---|---|---|---|---|
| current | 19:52, 11 March 2022 | | 1,550 × 1,475 (1.75 MB) | Maintenance script (talk | contribs) | == Summary == Importing file |
You cannot overwrite this file.
File usage
The following page uses this file: