File:Compressibility Factors.png: Difference between revisions
Jump to navigation
Jump to search
imported>Milton Beychok ({{Image_notes_ownworkpd |Description = Graphs of compressibility factor Z. Upper graph has 3 single gas examples. Lower graph shows how temperature affects Z value of a single gas. |CZ_username = ~~~~ |Note = I drew this myself using Microsoft's Paint program. |Other_versions = }} ==Licensing/Copyright status== {{PD-self}}) |
(== Summary == Importing file) Tag: Server-side upload |
||
| (2 intermediate revisions by 2 users not shown) | |||
| Line 1: | Line 1: | ||
== Summary == | |||
Importing file | |||
== | |||
Latest revision as of 19:56, 11 March 2022
Summary
Importing file
File history
Click on a date/time to view the file as it appeared at that time.
| Date/Time | Thumbnail | Dimensions | User | Comment | |
|---|---|---|---|---|---|
| current | 19:56, 11 March 2022 | 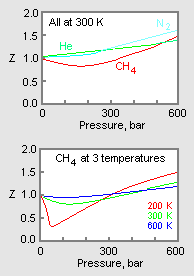 | 194 × 276 (4 KB) | Maintenance script (talk | contribs) | == Summary == Importing file |
You cannot overwrite this file.
File usage
The following 3 pages use this file: