File:AsinplotT.png
Original file (897 × 1,381 pixels, file size: 70 KB, MIME type: image/png)
Summary
| Title / Description
|
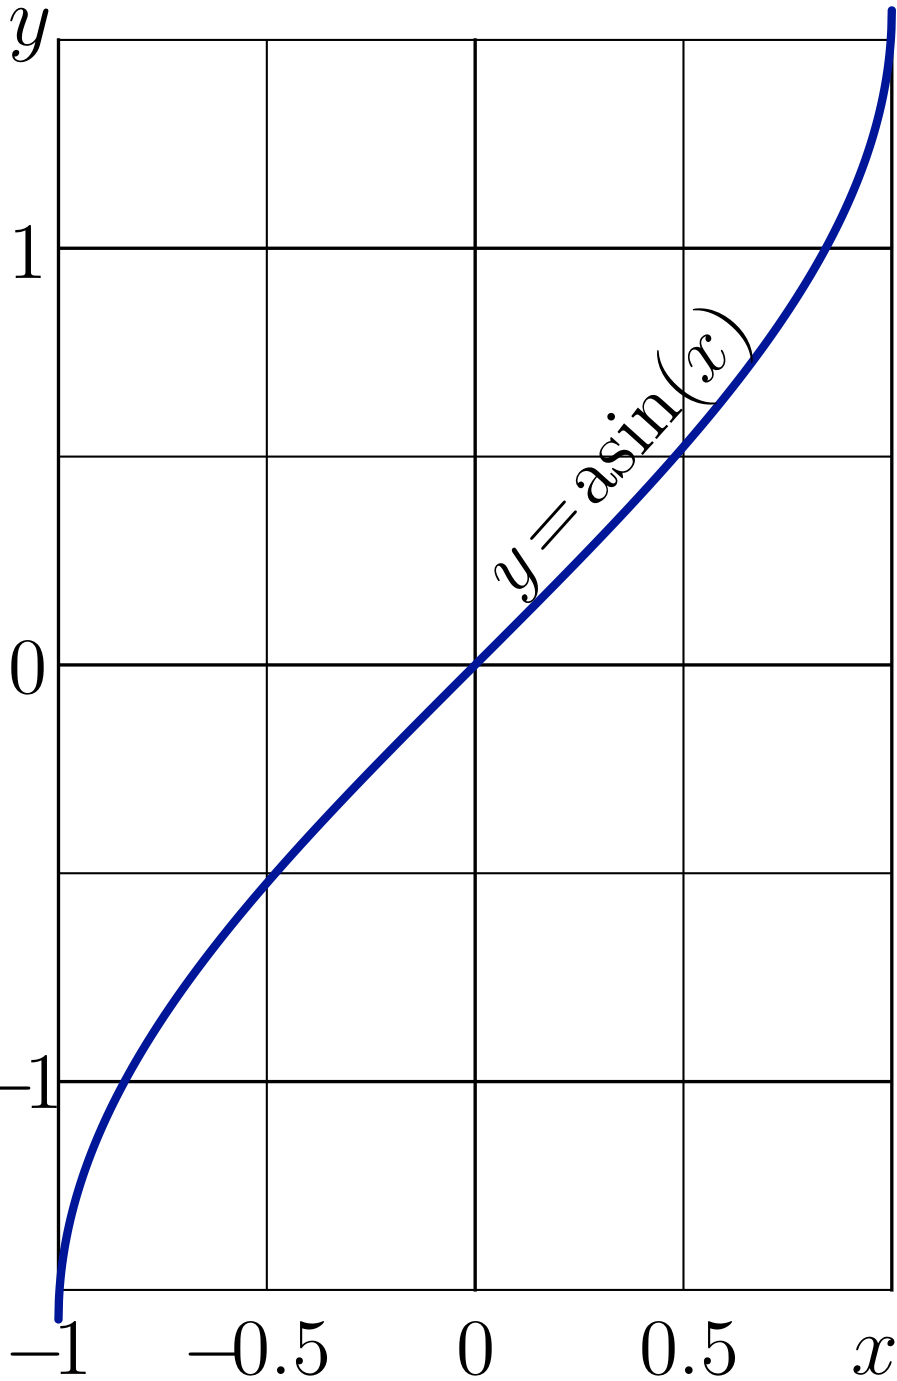
Explicit plot of function ArcSin of real argument |
|---|---|
| Citizendium author & Copyright holder
|
Copyright © Dmitrii Kouznetsov. See below for licence/re-use information. |
| Date created
|
2012 March 22 |
| Country of first publication
|
Japan |
| Notes
|
You can edit this page and add notes here which may be useful to people who wish to re-use this media. |
| Other versions
|
http://tori.ils.uec.ac.jp/TORI/index.php/File:AsinplotT.png |
| Using this image on CZ
|
, then copy the code below to add this image to a Citizendium article, changing the size, alignment, and caption as necessary.
|
Please send email to manager A T citizendium.org .
Licensing
This media, AsinplotT.png, is licenced under the Creative Commons Attribution 3.0 Unported License
You are free:
To Share — To copy, distribute and transmit the work; To Remix — To adapt the work.
Under the following conditions:
Attribution — You must attribute the work in the manner specified by the author or licensor (but not in any way that suggests that they endorse you or your use of the work).
For any reuse or distribution, you must make clear to others the licence terms of this work (the best way to do this is with a link to this licence's web page). Any of the above conditions can be waived if you get permission from the copyright holder. Nothing in this licence impairs or restricts the author's moral rights.
Read the full licence.
C++ geneator of curve
File ado.cin should be loaded to the working directory for compilation of the C++ code below:
#include <math.h>
#include <stdio.h>
#include <stdlib.h>
#define DB double
#define DO(x,y) for(x=0;x<y;x++)
using namespace std;
#include <complex>
typedef complex<double> z_type;
#define Re(x) x.real()
#define Im(x) x.imag()
#define I z_type(0.,1.)
#include "ado.cin"
z_type acos(z_type z){
if(Im(z)<0){if(Re(z)>=0){return  I*log( z + sqrt(z*z-1.) );}
                   else{return  I*log( z - sqrt(z*z-1.) );}}
           if(Re(z)>=0){return -I*log( z + sqrt(z*z-1.) );}
                  else {return -I*log( z - sqrt(z*z-1.) );} }
z_type asin(z_type z){
if(Im(z)<0){if(Re(z)>=0){return M_PI/2.-I*log( z + sqrt(z*z-1.) );}
                  else {return M_PI/2.-I*log( z - sqrt(z*z-1.) );}}
          if(Re(z)>=0){return M_PI/2.+I*log( z + sqrt(z*z-1.) );}
                 else {return M_PI/2.+I*log( z - sqrt(z*z-1.) );} }
#define M(x,y) fprintf(o,"%6.4f %6.4f M\n",0.+(x),0.+(y));
#define L(x,y) fprintf(o,"%6.4f %6.4f L\n",0.+(x),0.+(y));
#define S(x,y) fprintf(o,"S\n",);
main(){ int j,k,m,n; DB x,y, p,q, t; z_type z,c,d;
FILE *o;o=fopen("asinplot.eps","w");ado(o,220,330);
fprintf(o,"110 170 translate\n 100 100 scale\n");
for(m=-1;m<2;m++){M(m,-1.5)L(m,1.5)}
for(n=-1;n<2;n++){M(-1,n)L(1,n)}
 fprintf(o,"2 setlinecap .008 W 0 0 0 RGB S\n");
for(m=-1;m<2;m++){M(.5*m,-1.5)L(.5*m,1.5)}
DO(n,4){M(-1,-1.5+n)L(1,-1.5+n)}
fprintf(o,"2 setlinecap .005 W 0 0 0 RGB S\n");
DO(m,2001){ x=-1.+.001*m; z=x; y=Re(asin(z)); if(m==0)M(x,y) else L(x,y) }
fprintf(o,"1 setlinejoin 1 setlinecap .02 W 0 0 .6 RGB S\n"); p=1.8;q=.7;
fprintf(o,"showpage\n%c%cTrailer",'%','%'); fclose(o);
     system("epstopdf asinplot.eps");
     system(    "open asinplot.pdf");
     getchar(); system("killall Preview");//for mac
}
Latex generator of labels
The input file asinplot.pdf should be generated with the code above in order to compile the Latex document below.
% Copyleft 2012 by Dmitrii Kouznetsov %
\documentclass[12pt]{article} %
\usepackage{geometry} %
\usepackage{graphicx} %
\usepackage{rotating} %
\paperwidth 432pt %
\paperheight 665pt %
\topmargin -90pt %
\oddsidemargin -80pt %
\textwidth 900pt %
\textheight 900pt %
\pagestyle {empty} %
\newcommand \sx {\scalebox} %
\newcommand \rot {\begin{rotate}} %
\newcommand \ero {\end{rotate}} %
\newcommand \ing {\includegraphics} %
\begin{document} %
\parindent 0pt \sx{2}{ \begin{picture}(220,321) %
\put(4,0){\ing{asinplot}} %
\put(2,320){\sx{1.7}{$y$}} %
\put(2,264){\sx{1.6}{$1$}} %
\put(2,164){\sx{1.6}{$0$}} %
\put(-6, 64){\sx{1.6}{$-\!1$}} %
\put(1, 0){\sx{1.6}{$-\!1$}} %
\put(44, 0){\sx{1.6}{$-\!0.5$}} %
\put(110, 0){\sx{1.6}{$0$}} %
\put(154, 0){\sx{1.6}{$0.5$}} %
\put(205, 0){\sx{1.7}{$x$}} %
\put(124,187){\sx{1.6}{\rot{48}$y\!=\!\mathrm{asin}(x)$\ero}} \end{picture} %
} %
\end{document}%
Keywords
File history
Click on a date/time to view the file as it appeared at that time.
| Date/Time | Thumbnail | Dimensions | User | Comment | |
|---|---|---|---|---|---|
| current | 19:51, 11 March 2022 | | 897 × 1,381 (70 KB) | Maintenance script (talk | contribs) | == Summary == Importing file |
You cannot overwrite this file.
File usage
The following page uses this file: