File:Penplot.jpg: Difference between revisions
imported>Dmitrii Kouznetsov No edit summary |
imported>Dmitrii Kouznetsov No edit summary |
||
| Line 10: | Line 10: | ||
== Licensing == | == Licensing == | ||
{{CC|by|3.0}} | {{CC|by|3.0}} | ||
==Description== | |||
[[Pentation]] pen is [[superfunction]] of [[tetration]] to the same base. Natural pentation is solution $F$ of the [[transfer equation]] | |||
<math> | |||
F(z\!+\!1)=\mathrm{tet}\Big( F(z)) | |||
</math> | |||
constructed with [[regular iteration]] at the smallest real [[fixed point]] <math>L</math> of [[tetration]]; <math>L\approx -1.8503545290271812</math> is solution of equation | |||
<math>L=\mathrm{tet}(L)</math> | |||
with additional condition <math>F(0)=1</math>. | |||
The real-real plot <math>y=\mathrm {pen}(x)</math> is shown with thick black curve. | |||
The thin curves show approximations of pentation. | |||
The red horizontal line shows the fixed point of tetration, <math>y=L</math>. | |||
The thin blue curve shows the asymptotic of pentation at large negative values of the real part of the argument, | |||
<math> | |||
y= L+\exp(k(x+x_1)) | |||
</math> | |||
where <math>k\approx 1.86573322821</math> | |||
and <math>x_1 \approx 2.24817451898</math> | |||
The thin green line shown the deviation from the linear approximation | |||
<math>\mathrm{linear}(x)=1+x</math> | |||
The deviation is denoted as <math>~\delta(x)=\mathrm{pen}(x)-\mathrm{linear}(x)</math> | |||
In the range <math>-2.1\!<\!x\!<\!1.1</math>, the deviation is small, the linear approximation provides 2 correct significant digits. In order to make the deviation visible, it is scaled with factor 10, so, <math>y=10\delta(x)</math> is plotted. | |||
Revision as of 02:57, 4 September 2014
Summary
| Title / Description
|
plot of the natural pension , id set, pentation to base <maht>\mathrm e=\exp(1)\approx 2.71</math>, id set, pentation to base ; the thik black curve shows ; the thik black curve shows |
|---|---|
| Citizendium author & Copyright holder
|
Copyright © Dmitrii Kouznetsov. See below for licence/re-use information. |
| Date created
|
2014 |
| Country of first publication
|
Japan, Germany |
| Notes
|
The thin curves show the two asymptotics of pentation and the error of the linear approximation |
| Other versions
|
http://mizugadro.mydns.jp/t/index.php/File:Penplot.jpg |
| Using this image on CZ
|
, then copy the code below to add this image to a Citizendium article, changing the size, alignment, and caption as necessary.
|


Please send email to manager A T citizendium.org .
Licensing
This media, Penplot.jpg, is licenced under the Creative Commons Attribution 3.0 Unported License
You are free:
To Share — To copy, distribute and transmit the work; To Remix — To adapt the work.
Under the following conditions:
Attribution — You must attribute the work in the manner specified by the author or licensor (but not in any way that suggests that they endorse you or your use of the work).
For any reuse or distribution, you must make clear to others the licence terms of this work (the best way to do this is with a link to this licence's web page). Any of the above conditions can be waived if you get permission from the copyright holder. Nothing in this licence impairs or restricts the author's moral rights.
Read the full licence.
Description
Pentation pen is superfunction of tetration to the same base. Natural pentation is solution $F$ of the transfer equation

constructed with regular iteration at the smallest real fixed point of tetration; is solution of equation


with additional condition .

The real-real plot is shown with thick black curve.
The thin curves show approximations of pentation.
The red horizontal line shows the fixed point of tetration, .

The thin blue curve shows the asymptotic of pentation at large negative values of the real part of the argument,

where

and

The thin green line shown the deviation from the linear approximation

The deviation is denoted as

In the range , the deviation is small, the linear approximation provides 2 correct significant digits. In order to make the deviation visible, it is scaled with factor 10, so, is plotted.


File history
Click on a date/time to view the file as it appeared at that time.
| Date/Time | Thumbnail | Dimensions | User | Comment | |
|---|---|---|---|---|---|
| current | 19:52, 11 March 2022 | 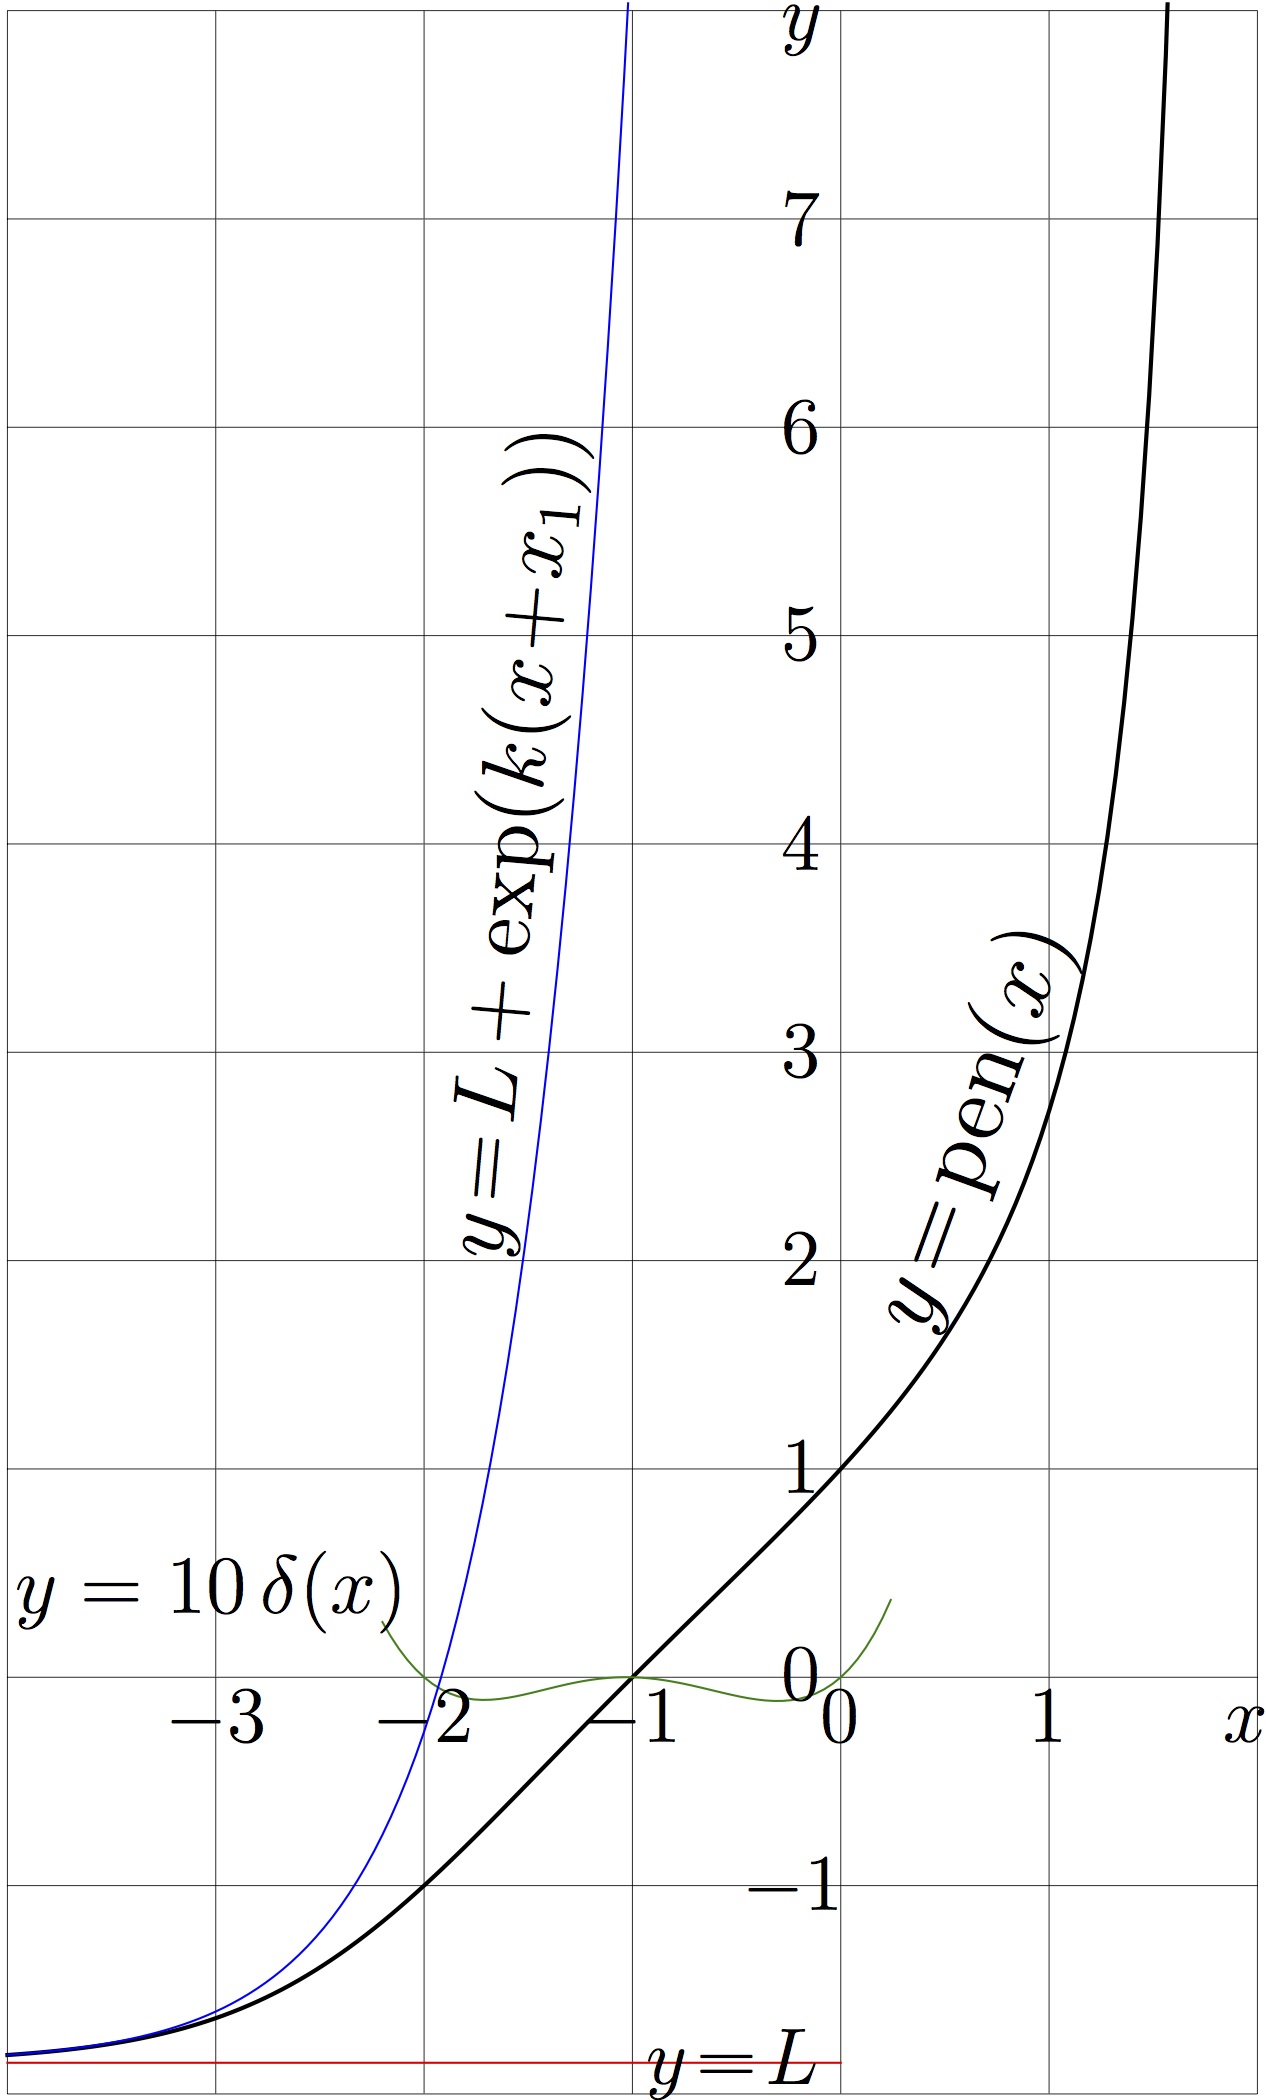 | 1,266 × 2,100 (240 KB) | Maintenance script (talk | contribs) | == Summary == Importing file |
You cannot overwrite this file.
File usage
The following page uses this file: